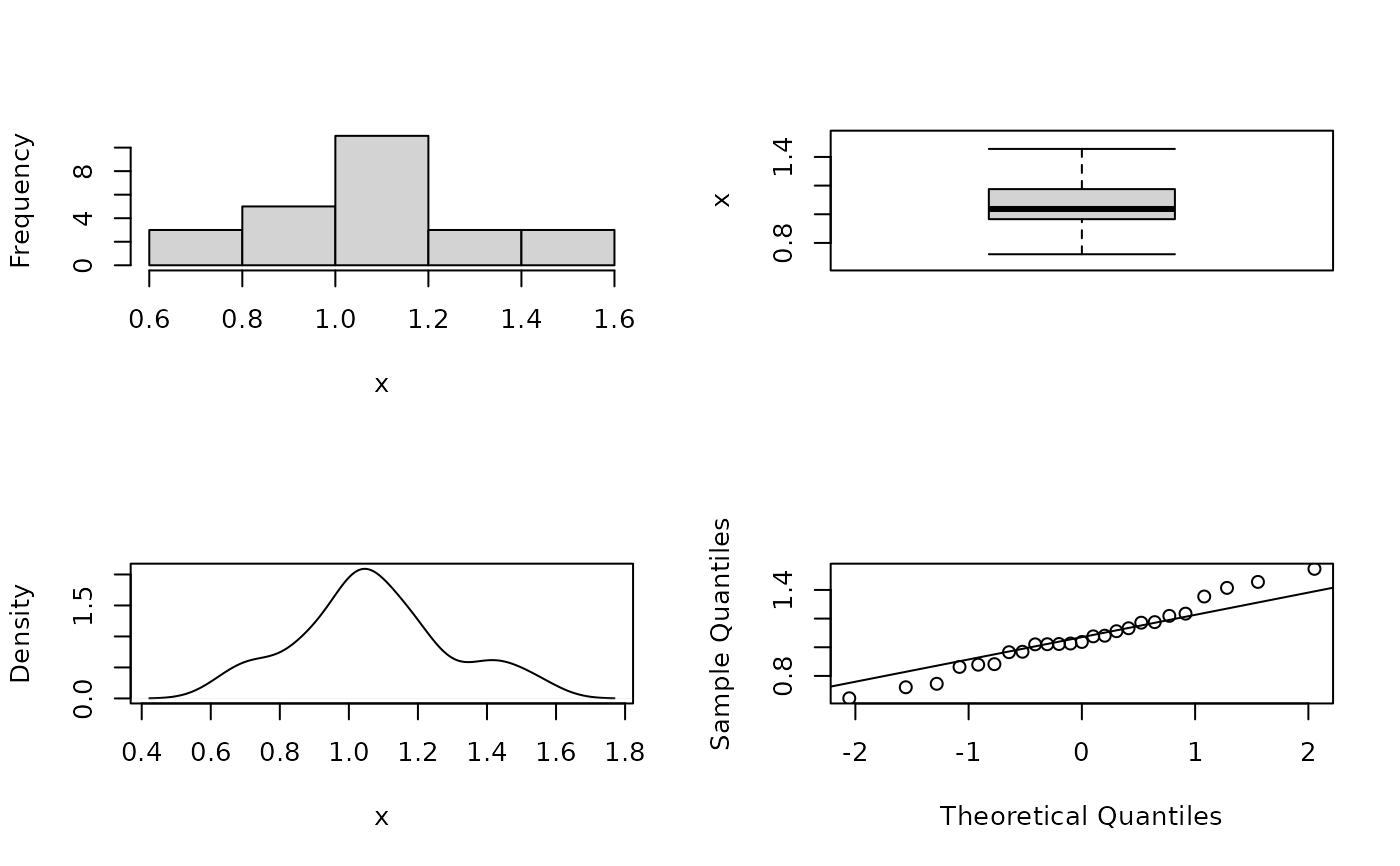
Generate distribution plots of an array.
eda.shape.RdGenerate histogram, boxplot, density, and quartile plots.
eda.shape(x,qq=TRUE,main=NULL,xlab,...)Arguments
- x
numeric array.
logical; for plotting quartile plot, default=TRUE.
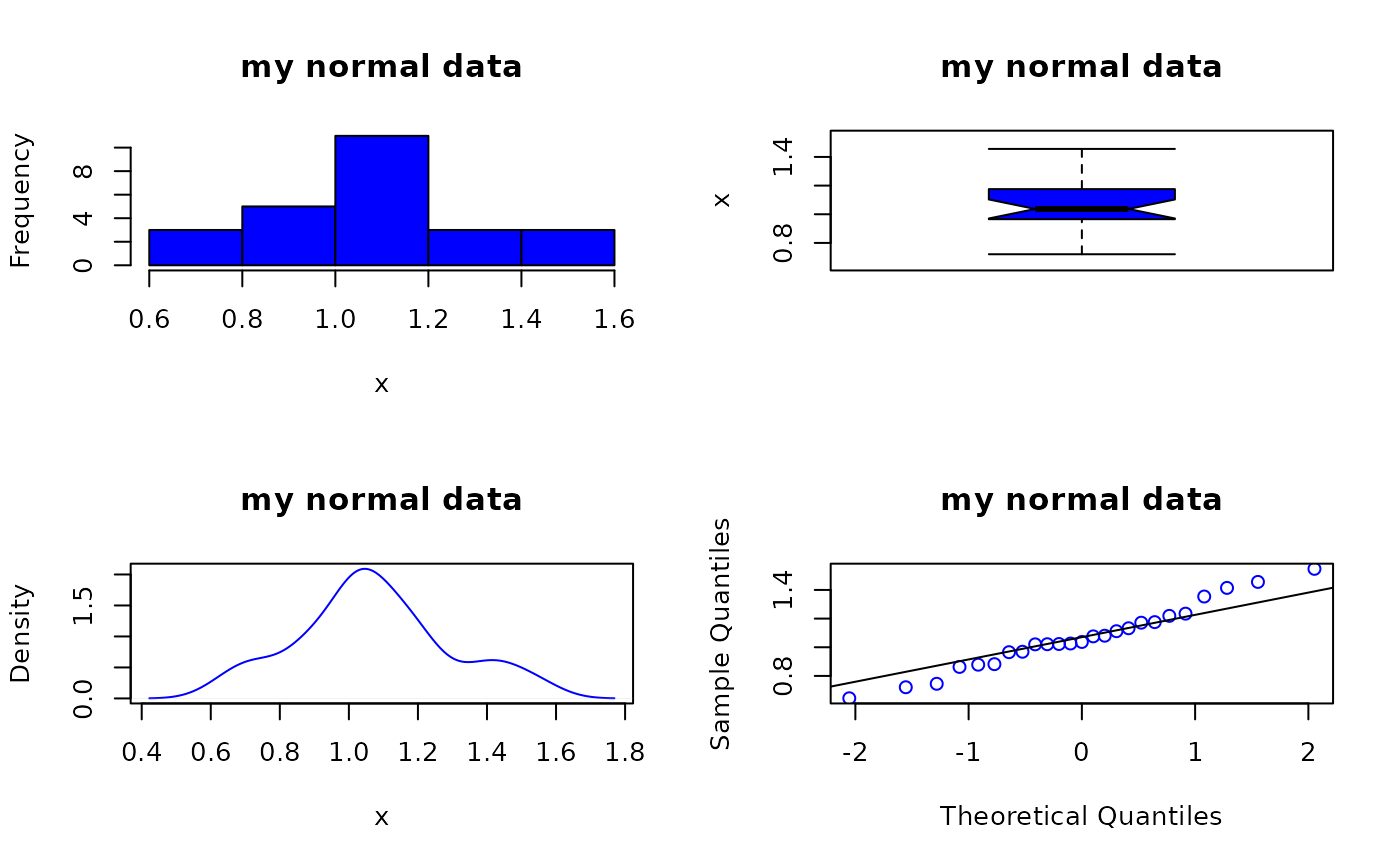
- main
character; main title for plots.
- xlab
x axis label for histogram and density plots, y axis label for boxplot. If not provided, will default to name of object x.
- ...
additional graphical parameters to pass to the plot functions called within `eda.shape`.
Details
This function is modified from the SPlus version of the same name, see references. Additional graphical parameters passed to `eda.shape` are ignored if not applicable/accepted by all internally called plot functions to prevent warning messages and/or null plots. To suppress axis labeling pass ann=FALSE as additional argument.
Value
Four plots on one page [mfrow = c(2, 2)]- histogram, boxplot, density, and quartile.
Note
Wrapper functions for each internally called plot type strip graphical parameters that are not applicable to the specific plot type to prevent warnings and errors.
References
TIBCO Spotfire S+ 8.2 2010. Guide to Statistics, vol. 1, p.124ff.